
Analytics
E-commerce KPIs: the short list that works
A dashboard with forty tiles is a decoration. Five numbers, read consistently and split by segment, are a steering instrument — provided everyone agrees on what they mean.
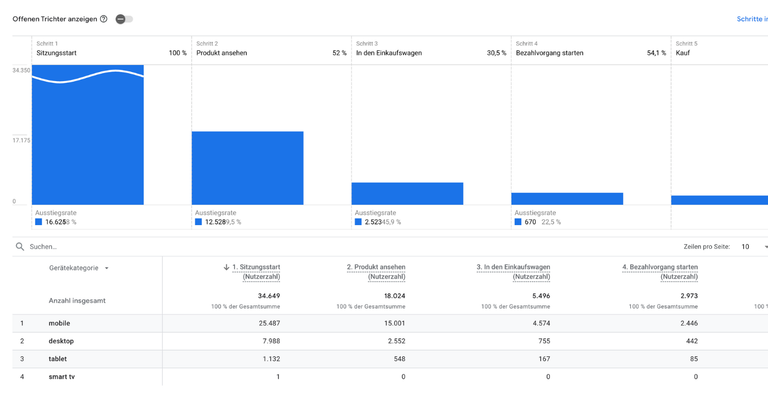
Most shops do not suffer from a lack of data. They suffer from numbers that nobody acts on, because the definitions differ between systems, because the average hides the segment that moved, or because the metric has no owner. The fix is not another tool. It is a shorter list, read the same way every week.
The revenue equation as a compass
Revenue equals sessions times conversion rate times average order value. Three factors, three sets of measures, three different teams. When revenue drops ten percent, the first useful question is which of the three moved — and the answer usually points at exactly one.
For any brand with repeat purchases there is a fourth factor: how often a customer comes back. It does not appear in the equation for a single month, but it decides whether you can afford your acquisition costs at all. A shop that grows only through new customers is buying its revenue at an increasing price.
Five metrics that are enough to steer
These five cover the equation and its consequences. Everything else is diagnostics you look at when one of the five moves.
- Conversion rate, always segmented. By device, channel and new versus returning. The total number is an average of very different behaviours and moves for reasons you cannot act on.
- Order value, median next to the mean. When the two drift apart, outliers are driving your number. The median describes what most customers actually do.
- Contribution margin after marketing. Revenue minus cost of goods, shipping, payment fees, returns and media spend. This is the only number that says whether growth is affordable.
- Repeat rate by cohort. Share of a month's new customers who order again within 90 and 180 days. Monthly slices hide this completely.
- Return rate by product group. Returns are a product and content problem before they are a logistics problem — a single group often drives the whole rate.
The numbers that get misread most often
Return on ad spend is the classic. It ignores margin and it ignores whether the revenue came from customers who would have bought anyway. A campaign with a high ROAS on returning customers can be the least profitable line in the budget.
Lifetime value predictions are a close second. Calculated from a thin history, they mostly reproduce the assumptions that went into them; used as a justification for acquisition spend, they turn an assumption into a budget. And last-click attribution reliably rewards the channel that stands closest to the door.
Traffic deserves a mention of its own. It is the easiest number to grow and the least connected to revenue. More sessions with a lower conversion rate is usually not growth — it is a change in traffic quality that nobody looked at.
Segmentation beats precision
A total conversion rate that has been stable for six months can contain a mobile rate that has been falling all along, compensated by desktop. Nothing in the dashboard shows this until the day desktop stops compensating. The same applies to countries, to channels and to product groups.
This is also why cohorts are worth the effort. Monthly revenue mixes first orders with repeat orders and hides both. A cohort view answers a much more useful question: are the customers we acquired in March behaving better or worse than the ones from January — and did the change we made in February have anything to do with it?
Where the numbers come from, and why they disagree
Shop backend, web analytics and ad platforms will never show the same figures, and chasing agreement is wasted time. They count differently: sessions versus users, orders versus conversions, cancellations included or not, different time zones, different attribution windows — plus the consent gap, which makes web analytics structurally incomplete in Europe.
The practical rule is to assign one source per question. Orders and revenue come from the shop, because that is where the money is. Behaviour and funnel steps come from analytics, read as trends rather than absolutes. Spend comes from the ad platforms, effect does not. Write the assignment down once; it ends the recurring meeting about which number is right.
A reporting rhythm that survives daily work
Daily, a short view: revenue, orders, and anything that looks broken. Weekly, the funnel and the channels, split by device and customer type. Monthly, contribution margin, cohorts and returns. Quarterly, assortment and strategy, where slower-moving numbers finally have enough data behind them.
One rule keeps this alive: every metric needs a person and a possible action. If nobody can name what they would do differently when a number moves, the number belongs in an archive, not in a weekly meeting.
What to take away
- Use the revenue equation to locate a problem before discussing measures: sessions, conversion rate, order value — plus repeat rate.
- Five metrics are enough: segmented conversion rate, median order value, contribution margin after marketing, cohort repeat rate, return rate by product group.
- ROAS, lifetime value predictions and last-click attribution mislead more often than they help.
- Segmentation beats precision — totals hide the segment that actually moved.
- Assign one source per question and give every metric an owner and a possible action.
A reporting set-up you would actually use
We define the metrics, sources and definitions for your shop and build a rhythm your team can keep up without a data department.
Continue reading
All articles →Conversion
The AIDA model in e-commerce
A century-old advertising framework, used as a diagnostic grid for product pages, cart and checkout — including the metrics for each stage.
Cart
Understanding and reducing cart abandonment
Why abandonment is normal, which causes are worth fixing, and why recovery emails are the last step rather than the first.
Revenue
Raising AOV: bundles, upsells, volume discounts
Which offer works in which place — and how to keep contribution margin from quietly disappearing while revenue goes up.